
As banks are busy digitalizing every corner of their firms to prepare for the “Fourth Industrial Revolution”, many seem to be missing a key complement to their digital adoption strategy which is digital engagement. According to RFi Group, true digital maturity is not just about technology, rather it is about having meaningful criteria to measure business transformation progress to adapt with the changing market (i). It is clear that with so many financial services providers existing in today’s market, banks are capitalizing on digital investments to compete in market share, but do they have the right models and metrics in place to quantify the returns of these investments? In other words, do banks have the criteria to measure the progress of their digital adoption strategy by measuring its digital engagement performance?
To gather some insight, we at Moneythor recently analyzed 54 banks in 13 countries to gauge if digital engagement is a priority measurement for banks and to find out more about the metrics that banks report on to track the efficacy and the productivity of their digital banking platforms.
Hidden figures of digital metrics
Through that review, it appears that many banks “bury” their digital metrics in paragraphs of different parts of their reports instead of highlighting them in a quantified method to give a clear representation of the numbers and comparison figures of the metrics.
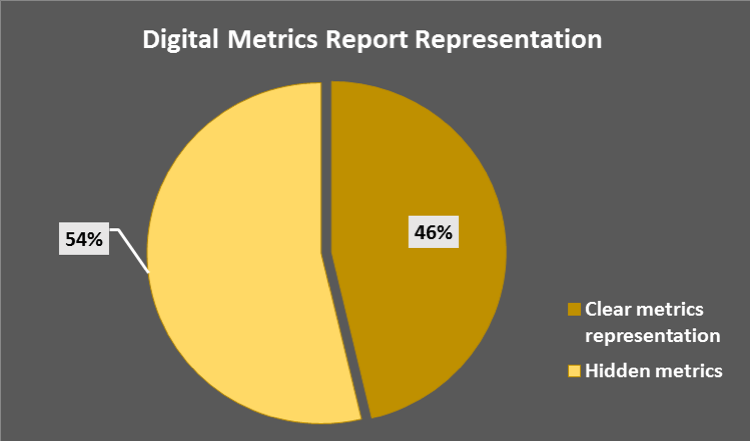
Out of 54 banks we have analyzed, only 24 banks (46%) clearly outline the results of their digital transformation strategy by dedicating a section of their report to the results of their digital metrics and year-on-year comparisons for these metrics. Digital metrics of the remaining 54% of the banks are however scattered in various sections of their reports and the metrics are often reported in approximate figures with no comparison of previous years’ results.
It is more than just digital users and transactions
From those banks’ annual and investor reports, we have also collected and categorized digital metrics into a common metric category and an insightful metric category. Metrics which fall under the common category are metrics which describe the general usage of the bank’s digital channels. On the other hand, the insightful category provides engagement measurements which are indicative of how reactive customers are to the banks’ digital channels.
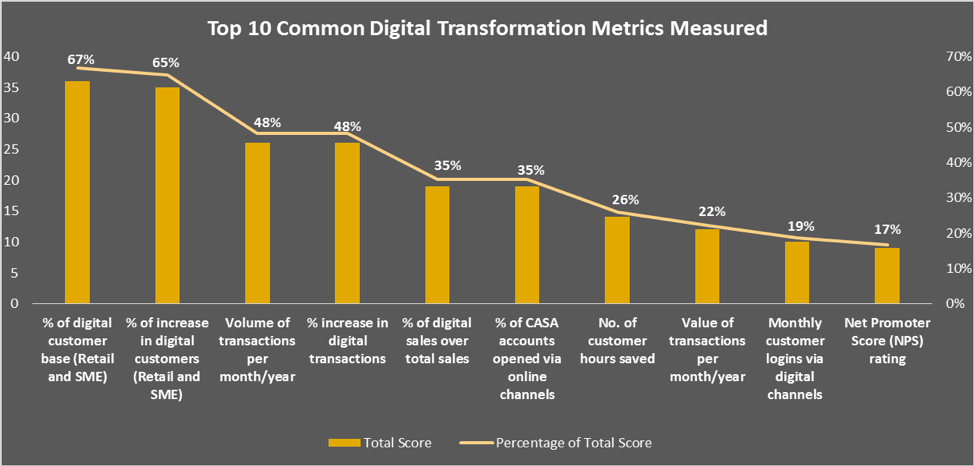
We then filtered the top 10 common digital metrics published by banks based on the total scores of each performance indicators (a score is given to each metric when a bank reports on the metric). As shown on Figure 2, out of 10 digital metrics, the top 4 metrics which banks consistently report are:
- Percentage of digital customer base (67%)
- Percentage of increase in digital customer base (63%)
- Volume of digital transactions (48%)
- Percentage of increase in the volume of digital transactions (48%)
The result suggests that the majority of banks are reporting their digital adoption progress mainly on “vanity indicators” (ii) such as the number of customers using their digital platforms and the number of transactions that is passing through the platforms. As part of our study, we have also asked survey takers if digital engagement metrics are being included in their remuneration scheme and the answer was that currently the most used engagement metrics are the number of active digital users and the volume of digital transactions which reinforce what we find based on our analysis of the common digital metrics being published.
However, albeit important, we believe that common indicators are only vague representations on the usage of banking apps and websites and are not enough to provide either the banks or investors the deep understanding of customer sentiments of the banks’ digital channels. Common digital metrics such as the number of active users are considered vanity metrics because it does not add much value to a bank’s bottom line. An example would be that even if a bank may have a high number of monthly active digital users, their digital banking channel may still be ineffective without knowing what are the features or digital capabilities of their online platform that are attractive to customers to frequently use their digital channels.
Knowing this, banks should not rely solely and report only on descriptive analytics. They should rather collect real-time snapshots of how engaged digital users are to the bank’s digital platforms and what digital users’ activities are on these platforms to accurately measure if their digital platforms are as impactful and meaningful enough to keep customers stick to them.
Banking: engaged or not engaged?
When compared to other performance indicators, banks usually have measurement models or methodologies to track those indicators and to provide year-on-year comparisons. However, when it comes to digital engagement, there seems to be minimal or no concrete evidence published to show that banks are actively tracking on how engaging they are on a digital level.
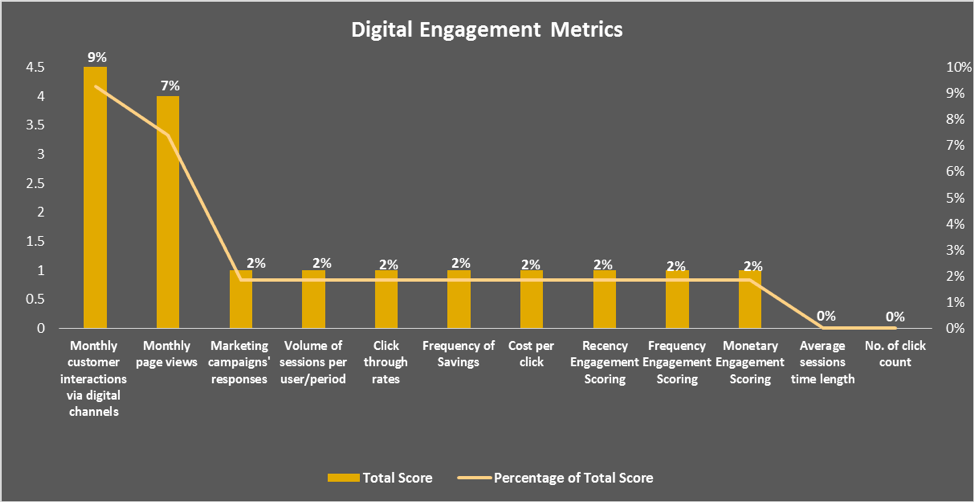
This is evident based on the result for our analysis on Figure 3 where the scores recorded for digital engagement are at a shockingly low rate. Here we see that there are only 9% of banks that reports on monthly customer interactions via digital channels and 7% are reporting on monthly page views with the latter not even always focusing on post-login views by actual customers but also including simple visitors to the bank’s website. Other engagement metrics such as recency engagement scoring and average session time length display even lower scores suggesting that even lesser banks are reporting these metrics on their annual reports.
In addition to that, based on our experience, we find that these metrics are being measured at a primitive level. For instance, most banks reports monthly customer interactions as a measure to track the number of digital secure sessions or logins rather than using the measure in a more meaningful way such as measuring customer interactive sessions only when digital users perform an interactive activity post-login to the digital channels. Hence, this made us question whether the digital engagement metrics measured by banks are being used optimally and accurately.
The verdict
Given that digital banking transformation is currently a prime objective for banking and essentially the hot topic amongst banks, it is concerning to find the following revelation based on our analysis results:
- Digital metrics are relatively hidden in banks’ published reports
- Digital metrics that are commonly measured are the number of active users and digital transactions volumes
- The majority of banks do not publish the results of digital engagement metrics
- Digital engagement metrics are being measured on a simplistic level
These therefore lead us to question, first of all, if banks are measuring digital engagement metrics internally at all and simply omit them from their reports? If this is the case, then why are they not reporting more on insightful engagement metrics and not just on vanity metrics to investors, given that true engagement metrics give meaningful insights on the impact of digital banking initiatives that are valuable not just for the bank but it will also be of interest to their stakeholders?
Our educated guess is that these figures today may still be too low or not “ripe” enough to either be measured and/or shared with their stakeholders. Or it could be that the bank is undertaking shallow digital banking efforts just to be in the digital trend for publicity purpose but in actuality does not have the measurements in place to track how well the bank is progressing to becoming a digital firm.
That being said, we have noticed that there are some leading banks that have begun tracking their digital progress in a more profound way. DBS Bank in Asia has developed a methodology to measure their digital value creation and has come up with behavioral criteria of what constitutes a digital customer (iii). Or BBVA in Spain tells investors the average times of customer interactions based on the level of digital activity performed within its mobile app and website (iv). JP Morgan Chase in the US is updating on the monthly average number of different types of digital activities undertaken by their customers using their digital offerings (v). Also, Commonwealth Bank of Australia is publishing the number of daily logons and the volume of unique customers for its CommBank app on a bi-yearly basis (vi).
Numbers matter: if you can measure it, you can manage it
As banking competition becomes more intense, banks need to keep in mind that in addition to digitalizing and automating their operational processes, they should start to have a plan of measure to track and report on the value generated from their digital investments. With good digital engagement measures in place, banks will have a better holistic view on how well their digital platforms are performing and thus be able to make improvements to their digital processes to remain competitive and adaptive in this digital age.
(i) Special Feature – Measuring up: Five key metrics to help Banks measure their “Digital Maturity” : https://www.rfigroup.com/rfi-group/news/special-feature-measuring-five-key-metrics-help-banks-measure-their-digital-maturity
(ii) Why you should ignore vanity metrics and focus on engagement metrics instead: https://www.forbes.com/sites/sujanpatel/2015/05/13/why-you-should-ignore-vanity-metrics-focus-on-engagement-metrics-instead/#4767f8c112a9
(iii) DBS Group Holdings Ltd 2017 Investor Report: https://www.dbs.com/investorday/presentations/Creating_shareholder_value_from_digitalisation.pdf
(iv) BBVA Group First Quarter 2018 Results: https://shareholdersandinvestors.bbva.com/wpcontent/uploads/2018/05/160520181Q18CorporatePresentation.pdf
(v) JP Morgan Chase 2018 Strategic Update: https://www.jpmorganchase.com/corporate/investor-relations/document/3cea4108_strategic_update.pdf
(vi) Commonwealth Bank of Australia First Half Year 2018 Result Presentation: https://www.commbank.com.au/content/dam/commbank/about-us/shareholders/pdfs/results/1h18/2018-half-year-results-presentation.pdf